Datasets from CSV
Columns are read as numbers, dates or text. Each upload is scanned, counts toward your storage and becomes a new version.
App
Your spreadsheet, as a dashboard people can read.
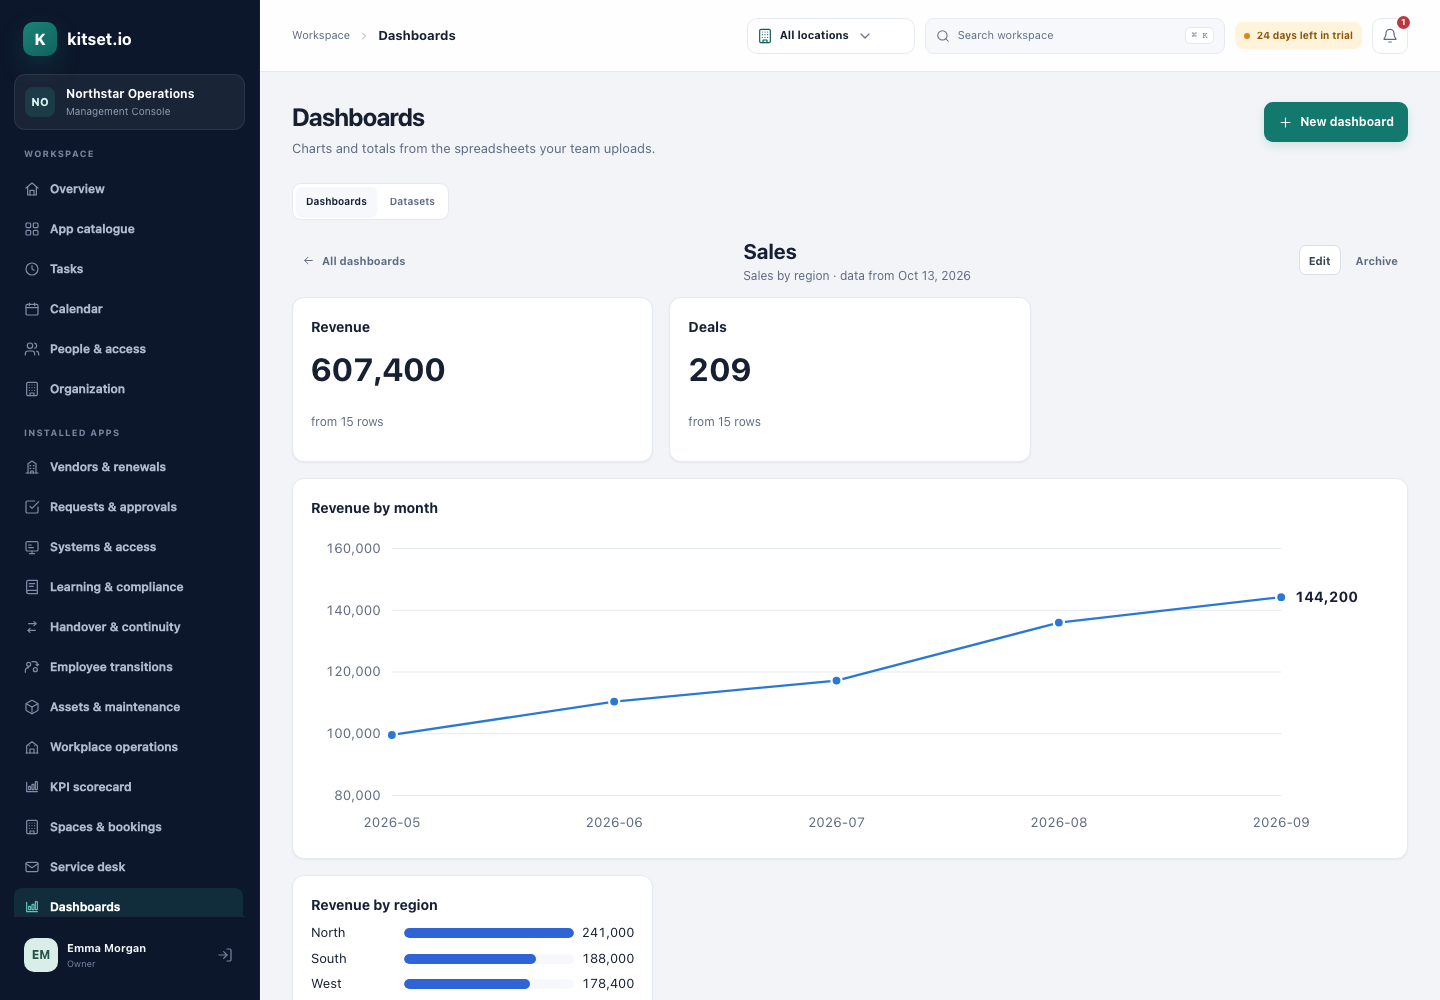
Upload the CSV a team already keeps. Build a dashboard of numbers, charts and tables from it, share it with a location, a department or a few people, and upload the next version to move every chart.
Columns are read as numbers, dates or text. Each upload is scanned, counts toward your storage and becomes a new version.
Numbers, bar charts, line charts, grouped tables and text: count rows, or the sum, average, smallest or largest of a column.
Group by a column or by month, and narrow each widget with up to five filters.
Share with everyone, a location, department, team, group or person. Viewers see the answers, never the rows.
Dashboards use the newest version of their dataset, so a new upload moves every chart built on it.
A spreadsheet's formulas are never evaluated, and files past the size, row and column limits are refused in words.
Add a dataset at a location or for the whole company, and upload its CSV.
Arrange numbers, charts and tables that ask questions of it.
Choose who reads the dashboard; upload a new version when the data moves.
Builders upload datasets, build dashboards and choose who they are shared with.
Employees open the dashboards shared with them and read the totals.
Targets and owners for the numbers you report every period.
Every plan includes some apps: Team 3, Growth 5 and Scale all 12. A plan includes your most expensive selected apps, and each app past that is billed at its own price. Past your plan's allowance, Dashboards is $19 a month, and annual billing charges 10 months for the year.
Not yet. Dashboards are built from the CSV files you upload.
No. Viewers see the answers each widget works out, never the rows of the dataset.
5 Console users, 500 Portal users, 25 GB of storage and any 3 apps, free for 30 days. No card, no call.